COVID-19 Analysis for Europe
Assignment 3
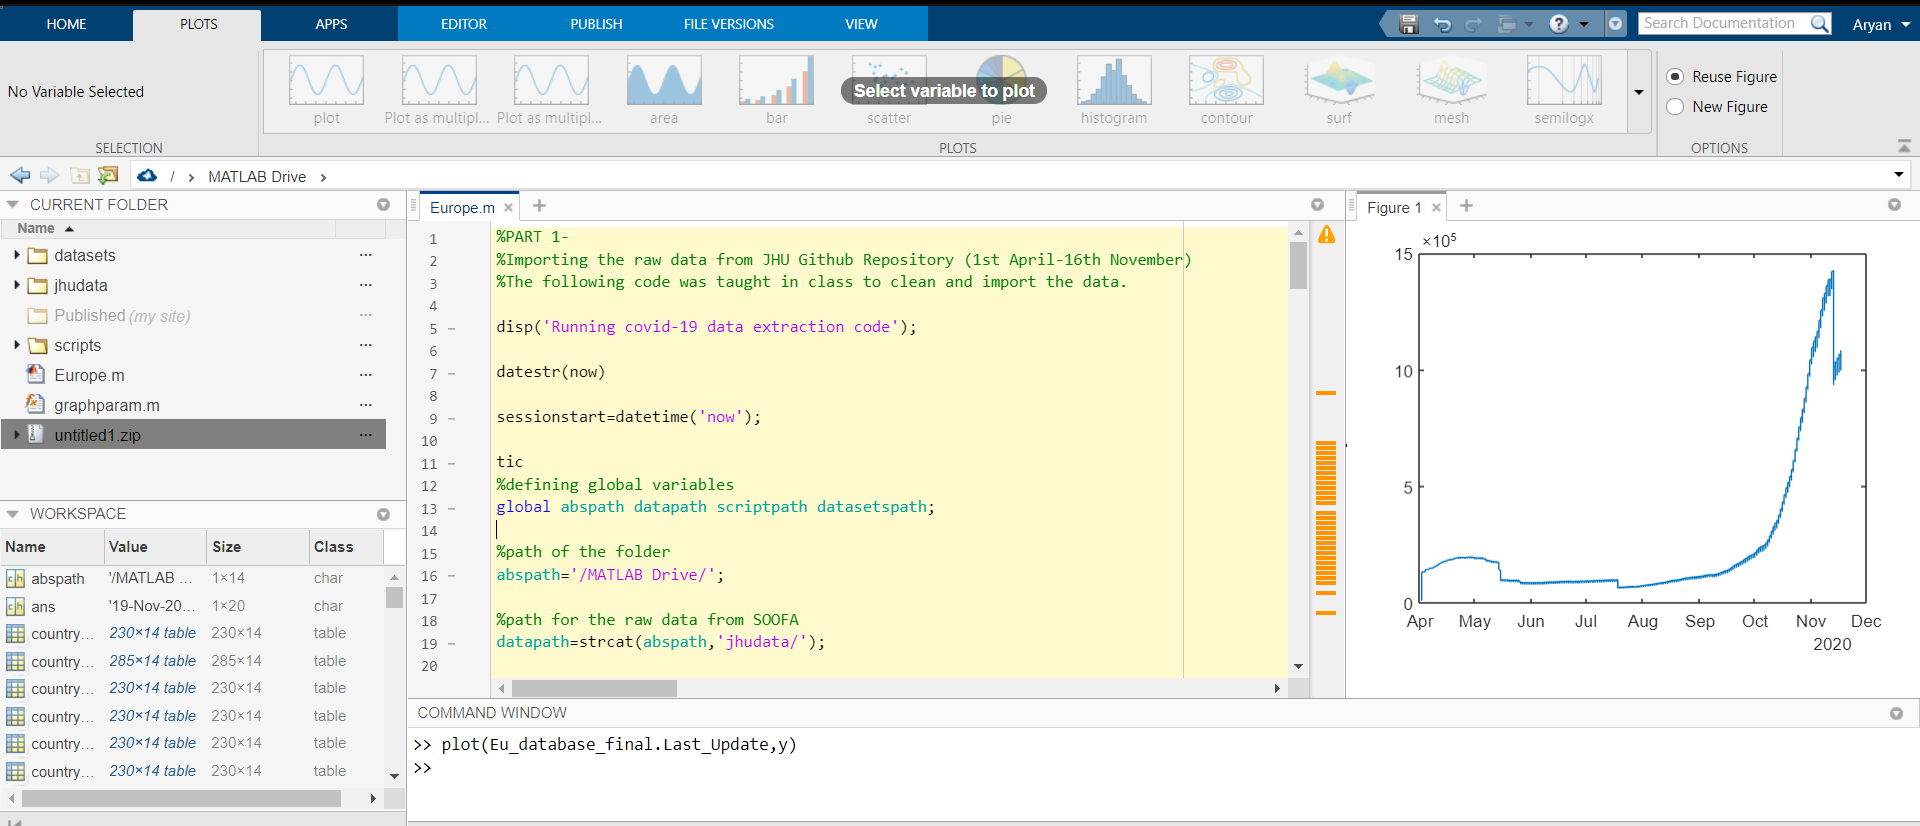
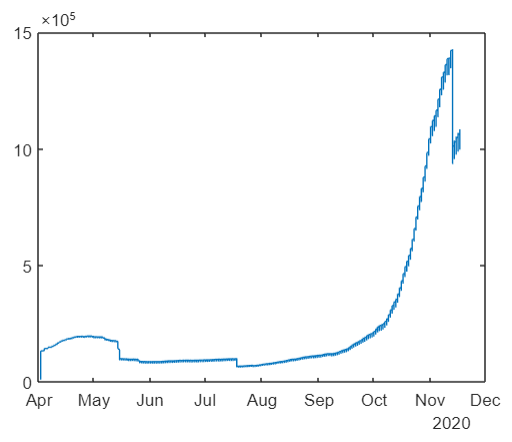
Can you validate this with the covid-19 datasets that you have or downloading fresh data from CSSE git repository? Please show the analysis using a time series plot (no. of deaths vs. day from 1st April till now). Please also find out if this is the case in your State as well. Show the visuals and the insights.
Link for the Scripts